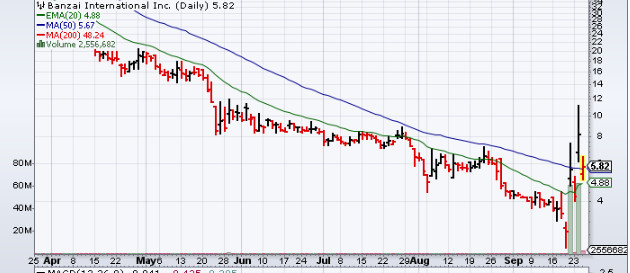
Banzai International Inc. (NASDAQ: BNZI) Stock Rallies On Debt Payoff and Restructuring Agreements: Now What?
Following a significant announcement with regards to its debt repayment and restructuring, Banzai International Inc. (NASDAQ: BNZI) was the focus of investors on Tuesday. The company’s stock went on a remarkable rally to end up with gains of as much as 96% to emerge as one of the notable gainers for the day.
Banzai Announces $24.8 Million Debt Payoff and Restructuring Agreements with Participation from Company Insiders
Banzai International is a marketing technology leader and known for providing vital sales and marketing solutions. Yesterday the company announced that it got into agreements with service providers and lenders for the purpose of writing off a maximum of $5.6 million worth of outstanding liabilities.
Additionally, the company also reached an agreement with the same parties with regards to the restructuring of an additional $19.2 million worth of its existing debt. The agreement would lead to a significant improvement in the overall financial position of Banzai International through the amendment of some credit obligations as well as the extension of some debt agreements.
Overall, it would lead to an expected reduction and restructuring of liabilities to the tune of $28.2 million. In light of such an announcement, there was considerable optimism among investors, and that perhaps led to the rally in the stock. It may be a good move to add the Banzai International stock to your watch lists today.
Key Quote
“These agreements are delivering on our commitments and taking meaningful steps to significantly reduce our debt burden and strengthen Banzai’s financial position,” said Joe Davy, CEO of Banzai. “I am confident that this restructure will provide the financial flexibility needed to significantly improve the company’s balance sheet, allowing us to continue executing our strategy to build a data-driven platform with essential marketing technology solutions that integrate seamlessly.
Traders Notes
| +/- EMA(20) | 4.89 (+18.92%) |
| +/- SMA(50) | 5.67 (+2.56%) |
| +/- SMA(200) | 48.24 (-87.95%) |
| 5-Day Perf. | +66.14% |
| 1-Month Perf. | -3.88% |
| 3-Month Perf. | -31.87% |
| 6-Month Perf. | -80.05% |
| YTD Perf. | -93.81% |
| 1-Year Perf. | -98.9% |
| RSI(14) | 53.63 |
| ATR(14) | 1.57 |
| ADX(14) | 25.39 |
| Beta (5Y) | 0.16 |

